
Oil & Gas Operations & Maintenance: From Field Inspection to Connected Asset Intelligence
Reliable operations depend on more than maintaining physical assets. They depend on maintaining a reliable information chain about those assets — from the ultrasonic thickness reading taken at a riser, to the asset record it belongs to, to the maintenance decision it informs.
Oil & Gas O&M keeps facilities, pipelines and equipment operating — safely, reliably, efficiently — for their whole operating life
Oil & gas operations and maintenance covers the activities required to keep facilities, equipment, pipelines and associated systems operating safely, reliably and efficiently throughout their operating life. That spans everything from a technician stroking a valve and recording its position, to a corrosion engineer reviewing a decade of thickness data from the same injection line.
Four terms that are related but not interchangeable
In everyday plant vocabulary, "maintenance" often absorbs everything above. The distinctions matter because each discipline owns different records, different intervals and different failure modes.
Operations
Running the facility within defined operating envelopes: startup and shutdown sequences, setpoints, alarm response, pigging runs, switchovers between trains, and the daily line-pack and throughput decisions that keep a gathering network balanced.
Maintenance
The physical work that keeps equipment serviceable: lubricating compressor frame bearings, replacing valve packing, calibrating pressure transmitters, overhauling a liquid-ring vacuum pump on a schedule or in response to a defect.
Asset integrity
The broader assurance that equipment remains fit for its intended purpose — corrosion management, thickness surveys, relief-system verification, fitness-for-service assessments — of which maintenance work is one part.
Reliability
The performance that results: how often a compressor train completes its runs between interventions, how long a valve holds seat, and how predictable the whole facility behaves between turnarounds.
Why O&M is unusually important in oil & gas
Most industries maintain equipment. Oil & gas combines nearly every factor that makes maintenance hard: high-energy processes, pressurized equipment carrying hydrocarbons, complex process systems, corrosion and material degradation, mechanical wear, extreme temperatures and pressures, remote operating locations, and enormous numbers of interconnected components — much of it safety-critical. A failure plays out across several dimensions at once:
Safety
Personnel and process safety can be affected by loss of containment, equipment failure, fire, explosion, or failure of safety barriers. A corroded pipe wall and a disabled emergency-shutdown valve are the same category of problem: barriers eroding quietly.
Environment
Leaks and releases — a weeping valve stem on a scrubber dump line, a produced-water tank overfill, a flange seep at a manifold — can result in environmental impacts that trigger reporting obligations and remediation work.
Production
A single failed cross-over valve can force a train offline; a compressor trip can back up an entire gathering system. Equipment failures reduce throughput or cause unplanned shutdowns whose cost compounds hourly.
Cost
Emergency repairs at 2 a.m. cost more than planned work: expedited parts, overtime callouts, scaffolding over live equipment, plus lost production, investigation time, and additional inspection demands afterward.
Regulatory / compliance
Inspection, testing, maintenance, documentation and integrity-management requirements can be tied to applicable regulations, codes, standards and company procedures — and the scope differs by jurisdiction, facility type, and process. One program rarely maps onto the next.
The common thread
None of these dimensions is managed by equipment condition alone. Each depends on knowing what the equipment is, where it is, what shape it is in, and what has already been done to it — which is why information quality is an O&M concern, not just an IT concern.
Macondo / Deepwater Horizon: barriers and the systems that manage them
The 2010 Deepwater Horizon disaster is sometimes summarized as a "maintenance failure." That summary is not supported by the investigations. The U.S. Chemical Safety Board (CSB) and other investigators identified multiple contributing technical, procedural, organizational and safety-management issues. Among them, the CSB documented deficiencies relating to safety-critical elements and the management systems intended to ensure that critical equipment — including the blowout preventer and related barriers — was reliable and available when needed.
The transferable lesson is not "maintain your BOP." It is that major-accident prevention depends on the integrity of physical equipment and on the systems used to identify, inspect, test, maintain, verify and manage safety-critical elements — the same information chain this article follows. Read the CSB investigation report for the full findings.
A loop, not a checklist
O&M is usually drawn as a cycle for a reason: the "record" and "learn" stages are what turn one inspection into better planning for the next one. Skip them and every cycle starts from zero. Note that actual O&M programs differ significantly by asset class, jurisdiction, operator, facility and applicable standards — this is the general shape, not a universal procedure.
Plan
Define maintenance strategies, inspection intervals, procedures, resources and priorities.
Operate
Run assets within defined operating envelopes and standard procedures.
Inspect
Collect observations and measurements about equipment condition.
Monitor
Track operating conditions, equipment health, alarms and trends.
Assess
Decide whether observed conditions need investigation, maintenance, repair, monitoring or engineering assessment.
Maintain
Perform preventive, corrective, condition-based or other maintenance.
Verify
Confirm equipment or systems meet applicable requirements after intervention.
Record
Preserve what happened, where, on which equipment, what was observed, what was done.
Learn
Use history to improve future inspection and maintenance decisions.
Repeat
Feed learning back into the plan — the loop is the point.
Select a stage
Hover over or select any stage on the circle to see what it involves. The cycle is continuous: the "Record" and "Learn" stages are what turn one inspection into better planning for the next one.
Six strategies, one question: what triggers the work?
Every maintenance program mixes several of these. The differences come down to what triggers the wrench: a failure, a calendar, a measurement, a model, a risk ranking, or a failure-mode analysis. Select a strategy to see where it fits — and where it does not.
Condition-Based Maintenance
Maintenance decisions based on observed equipment condition. Potential inputs include vibration, temperature, pressure, flow, lubricant condition, thickness measurements, leak observations, acoustic information, electrical measurements and inspection findings.
Assets with measurable, trending degradation indicators — wall-thickness loss, bearing vibration, lube-oil particle counts.
CBM depends on collecting meaningful condition information consistently. Without repeatable measurement points, methods and units, trends are not comparable.
Integrity is a lifecycle property, not a maintenance task
Asset integrity is the coordinated management of assets so they remain fit for their intended purpose and operate safely and reliably throughout their lifecycle. An asset's integrity is shaped long before the operations team touches it — in how it was designed, built and commissioned — and it is proven (or eroded) through every inspection, repair and modification that follows:
Because integrity involves more than maintenance alone, its scope is wide:
A useful regulatory reference point: OSHA's Process Safety Management standard (29 CFR 1910.119) includes mechanical-integrity provisions covering pressure vessels, storage tanks, piping and valves, relief systems, emergency shutdown systems, controls, sensors, alarms, interlocks and pumps. Those requirements are specific to the regulatory scope in which the PSM standard applies — they are a good illustration of what "mechanical integrity" means in practice, not a universal rulebook for every facility or jurisdiction.
What O&M teams actually need to know about an asset
Here is a mental exercise. Take one valve on a scrubber at a compressor station and list everything a competent team would want on file before deciding anything about it. It quickly outgrows any single spreadsheet row:
Asset identity
Who is this piece of equipment, unambiguously?
Physical context
Where does it sit in the process and in the world?
Condition
What state is it in right now, and how do we know?
Evidence
What backs the finding if someone questions it in two years?
History
What has happened to it before, and in what order?
Action
What happens next, and who knows it is done?
This is why a simple spreadsheet row — tag, date, reading — is often an incomplete representation of an industrial asset. It captures condition, maybe, and discards context, evidence and history.
Why maintenance data itself has a standard
ISO 14224:2016 — Petroleum, petrochemical and natural gas industries — Collection and exchange of reliability and maintenance data for equipment — establishes a standardized basis for collecting and exchanging reliability and maintenance data: equipment data, failure data and maintenance data. It also addresses data quality and standardization so information can move between organizations and facilities and still mean the same thing.
The standard exists for a simple reason that is the through-line of this whole article: good maintenance decisions depend on good maintenance information.
Equipment is consistently identified
Failure modes are consistently described
Maintenance actions are structured
Dates are preserved
Locations are known
Measurements use consistent units
Photos remain associated with the correct asset
Related records can be connected
The pattern is familiar to any inspection engineer: the raw numbers existed somewhere the whole time — on paper, in photos, in someone's memory of the 2019 turnaround — but not in a form that can answer a question.
Most O&M information is born at a fence line, a scraper trap or a scrubber deck
Many O&M activities originate in the field, far from any desktop system. A technician or inspector may need to capture, in one visit:
The information then needs to move along a chain of very different readers:
Not every O&M organization runs on legacy methods — but these are common workflow patterns, and each is a place where information can become disconnected from its asset along the way:
The pattern is rarely one broken system. It is many adequate systems that each hold a fragment, with the connections between them living in people's heads.
Why asset context matters: data, information, operational intelligence
Consider one real-shaped observation, the kind that lands in a spreadsheet every day:
"Valve V-103 failed inspection"
Which valve? At which of six facilities? Isolated equipment, or does the tag sit between a scrubber and a compressor suction header? Can anyone retrieve what was observed last time?
Which facility?
Which process stage?
Which train?
Where is the valve?
What system is it part of?
What inspection was performed?
What was measured?
What was observed?
What photos were taken?
What happened previously?
What related equipment may be affected?
What action was taken?
A connected record answers those questions by construction. The distinction is worth naming precisely, because it is one of the strongest ideas on this page:
A measurement, observation, photo or status. “6.2 mm wall”, “stuck throttled”, a picture of a stem seal. Cheap to capture, meaningless alone.
Data placed into meaningful context: that 6.2 mm belongs to riser R-204 at the Wolf Creek gathering manifold, measured by UT on 14 March, at the point flagged as TML-3.
Information connected across time, location, assets and workflows — so a team can understand what is happening and decide what to do next, and defend that decision later.
What the connected record looks like instead
Same finding, now answering the twelve questions before anyone has to ask them (values shown are illustrative demo data):
This is the shape of record that inspection programs spend years trying to assemble from paper archives — which is exactly what the OSHA oil & gas eTool on equipment condition points at when it lists inspection, maintenance and repair history, corrosion observations and documentation as the things that need to exist and stay available.
Facility
Wolf Creek Compressor Station — Train 1
Process stage
Stage 2 — Inlet separation & scrubbing
Asset
V-103 — auto-dump valve, scrubber liquid outlet (demo data)
Inspection performed
Quarterly visual + functional leak check of dump valve
Measured / observed
Position: stuck throttled. Condition: minor weeping at stem during auto-dump cycle.
Photos
2 photos of stem seal, timestamped, GPS-tagged
Previous history
Same observation trending worse across last three quarterly inspections
Related equipment
Liquid carry-over downstream to Stage 3 compressor rod packing
Action taken
Severity: moderate. Work order raised for repack; reinspection set for next quarter
A map is the first level of context
A single operating network can contain multiple facilities, pipelines and gathering systems, wells, compressor stations, processing equipment, storage, valves and inspection locations. A map provides the first level of context: where something is, relative to everything else that matters. Spatial visualization can then help a user drill from a broad operational view down to a specific asset or inspection record — click a station on the map below to try the idea (locations and findings are illustrative demo data):
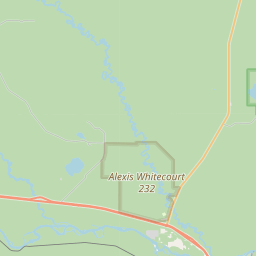
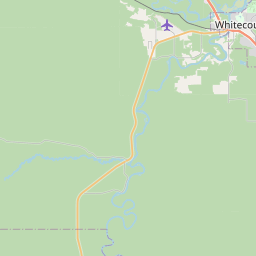
Wolf Creek Compressor Station
Pressure boosting + inlet separation
V-103 — Scrubber auto-dump valve
Minor weeping (demo data)C-201A — Compressor, Train 1
Nominal (demo data)V-205 — Liquid knockout vessel
Nominal (demo data)Regional / network view
Facility
Process area
Asset
What is a digital twin — and what is it not?
The term "digital twin" is used in different ways, and that matters when evaluating claims. Not every 3D model is a full digital twin. In practice, twins range across a spectrum:
SPECTRUM 01
Static digital representation
A 3D model or document set that mirrors the physical layout — useful for orientation and planning, but not updated by operations.
SPECTRUM 02
Spatial model + asset information
A 3D or GIS representation connected to asset records: click a vessel, see its tag, inspections and documents.
SPECTRUM 03
Model updated with inspection & operational data
Field inspections, thickness readings and operating data flow into the model, so it tracks the asset's actual condition.
SPECTRUM 04
Highly integrated twin
Real-time data, simulation, analytics and other models combined — the most ambitious form, with the hardest data, validation and interoperability requirements.
Recent peer-reviewed literature — including 2025 systematic reviews of digital twins for oil-and-gas production systems and processing plants — identifies real applications in operations monitoring, asset integrity, maintenance, failure prediction, process optimization, planning and lifecycle management, and names data integration, validation, interoperability and lifecycle considerations as the key challenges.
A twin is not automatically valuable because it is 3D. The useful question is: what operational information is connected to the digital representation, and what decision does that connection help support? If nothing is connected, it is a picture.
The digital twin information hierarchy
Connected asset intelligence is easiest to understand as a stack of questions. Each level only makes sense in the context of the one above it:
LEVEL 1
Geographic context — Where is the facility?
GIS mapLEVEL 2
Facility context — Where is the equipment within the facility?
Facility / process-area modelLEVEL 3
Asset / subsystem context — What equipment is involved?
Equipment / subsystemLEVEL 4
Inspection evidence — What was observed?
Measurements + photos + observationsLEVEL 5
Historical context — How has it changed?
Inspection / maintenance history and trendsA reader who can travel that stack — map, to process area, to equipment, to evidence, to history — is working with connected asset intelligence. A reader who cannot is assembling it by hand, every time.
A dashboard and an operational model answer different questions
Traditional dashboard — answers
“What are the numbers?”
“What's red today?”
“Which KPI missed target?”
Spatial / connected operational model — can help answer
“Where is the problem?”
“What equipment is affected?”
“What is connected to it?”
“What happened previously?”
“What evidence supports the finding?”
“How is the condition changing?”
One does not replace the other. A dashboard, GIS system, 3D model, CMMS, historian, SCADA system, engineering system and inspection database each serve different purposes — the operational value comes from how they connect.
Data integration is the real challenge
Industrial organizations run many specialized systems, each excellent at its own job:
Digital transformation is not simply "put everything into one database." The challenge is connecting the right information while preserving:
Identity
Context
Time
Location
Relationships
Data quality
Governance
Security
Traceability
From field collection to closed loop, in twelve steps
This is a conceptual information workflow — not a universal maintenance procedure. Actual inspection and maintenance procedures are governed by applicable standards, codes and company programs. The workflow describes how information can flow so the physical work has a defensible record behind it.
Define the asset
Agree on identity: tag, type, parent/child relationships, location.
Build the inspection / maintenance form
Structured fields, controlled pick-lists, photo and GPS capture.
Collect structured field data
Technicians record observations against defined fields, not free text alone.
Attach photos and evidence
Evidence stays connected to the observation and the asset.
Validate and organize the record
Required fields, units and formats checked before the record is trusted.
Connect the record to the asset
The finding lives with V-103, not in a folder named 'March'.
Preserve historical context
Dates, methods and measurements retained for comparison.
Visualize spatially
Condition visible on a map or facility model, not buried in a report.
Analyze trends
Repeated comparable inspections reveal direction, not just snapshots.
Support inspection / maintenance decisions
Planners and engineers see the same connected record.
Record the outcome
What was done, by whom, verified how — closure, not a verbal update.
Feed the history back into future work
Next interval, next method, next decision inherits the context.
A three-stage natural gas facility, end to end
Picture a regional natural gas gathering network with multiple compression facilities. Gas arrives from wellheads at a gathering manifold (inlet piping, risers, isolation headers, cross-over valves), passes through inlet separation and scrubbing (liquid knockout vessels, level monitoring, auto-dump valves, drain systems), then enters pressure boosting (gas compressors, rod packing, lube oil systems, discharge cylinders).
Now consider a hypothetical chain: an auto-dump valve in Stage 2 degrades — stuck throttled, weeping at the stem. Liquid handling in the scrubber suffers. Liquids carry over. Downstream, the Stage 3 compressor's rod packing sees them, and lube-oil consumption starts climbing on one train but not its sister.
Nothing here is a universal failure mechanism — carry-over has many causes and packing wears for many reasons. The point is what the records make visible: only if the valve finding, the compressor observation and the facility layout stay connected can a team see the relationship at all.
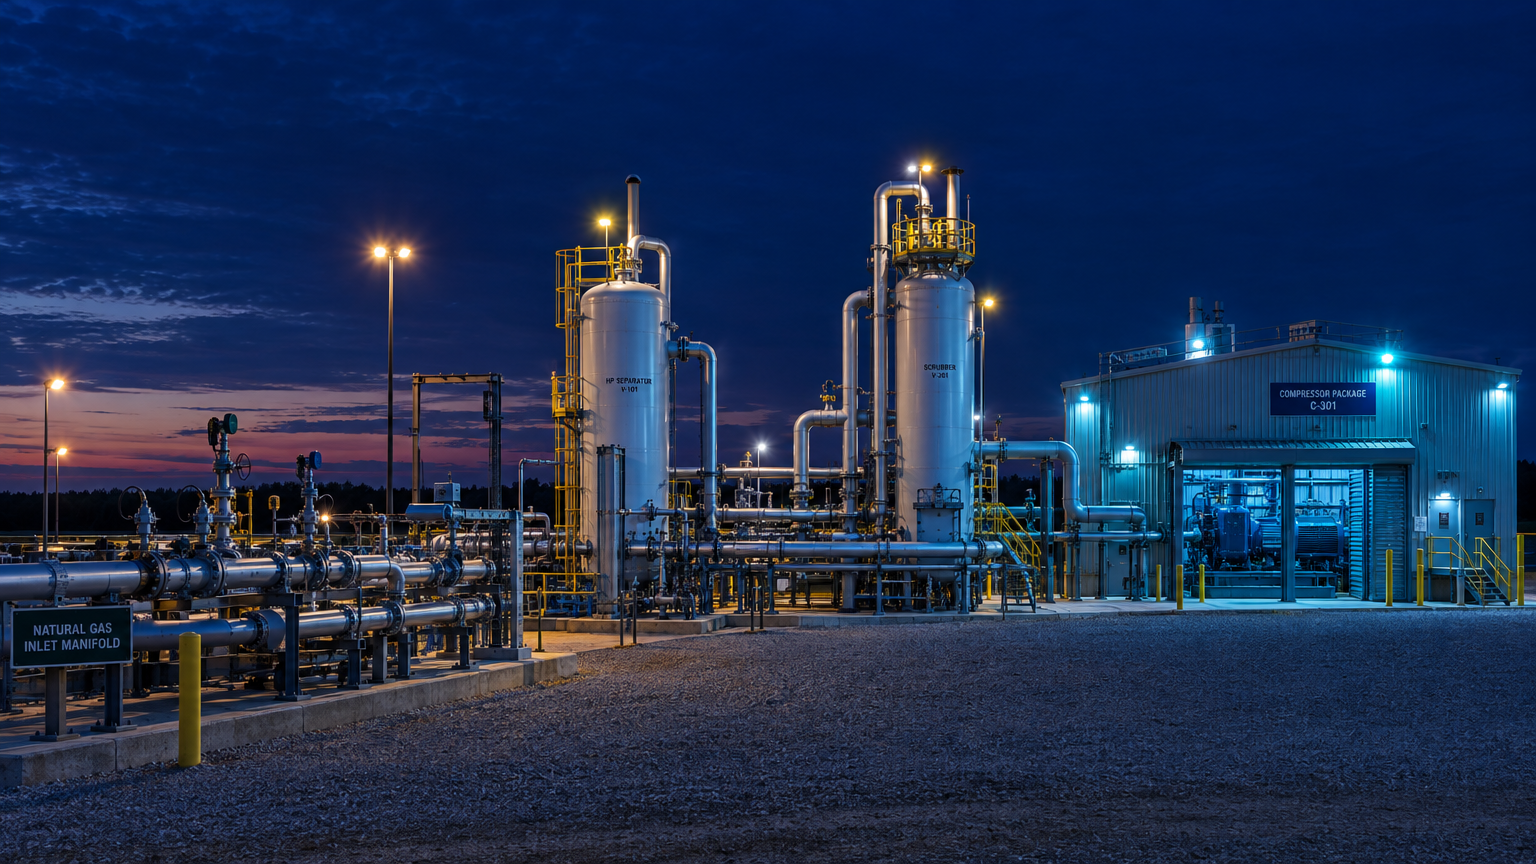 The three process stages in their physical setting. Click a stage in the model below to drill in.
Wolf Creek station
›Separation & scrubbing
›V-103
V-103 — Auto-dump valve, scrubber liquid outlet
Liquid knockout vessels, level monitoring, auto-dump valves and drain systems protect downstream equipment from liquid carry-over.
The connected data story, in one line
Follow the trail a planner would have to walk to connect a compressor symptom back to a scrubber valve — manually:
The point is not that software automatically diagnoses the failure — engineering interpretation is what turns observations into a cause. The point is that connected data makes the relationship between observations, equipment, location, history and follow-up possible to see, instead of something that has to be reconstructed from a PDF archive.
What connected records make visible
None of the analytics below is universally predictive — they are examples of what becomes possible when repeated inspections use the same fields, methods and units. All values are illustrative demo data.
Condition trend
Ultrasonic thickness at TML-3, inlet riser (demo data)- Riser R-204 (UT, mm)
- Sister riser R-205 (UT, mm)
- Minimum required thickness (4.8 mm)
- Nominal (7.9 mm)
Inspection finding timeline
2022 · Nominal
Quarterly inspection: dry, full travel2024 · Minor defect
Suspect seat; slight delay in dump cycle2025 · Repair
Stem repacked; temporary improvement2026 · Reinspection
Weeping returns + stuck throttled — replacement scheduledAsset condition matrix
Comparing assets across condition, inspection date, severity and maintenance status (demo data).| Tag | Asset | Condition | Last inspection | Severity | Maintenance status |
|---|---|---|---|---|---|
| V-101 | Header 1 isolation valve | No leak / nominal | 2026-02-11 | Low | None — scheduled interval |
| V-103 | Scrubber auto-dump valve | Active weep + stuck throttled | 2026-02-11 | Moderate | Work order open — repack |
| V-104 | Cross-over valve | Stuck throttled | 2026-01-28 | High | Actuator replacement planned |
| C-201A | Compressor rod packing (Train 1) | Elevated lube-oil make-up | 2026-02-04 | Moderate | Joint investigation |
| V-205 | KO vessel level system | Nominal | 2025-11-19 | Low | None |
A careful word about "predictive"
These terms get used interchangeably in marketing. They are not interchangeable:
Historical visualization
Showing what was recorded: a list of past thickness readings on a chart. Descriptive, not inferential.
Trend analysis
Comparing repeated measurements to see direction: wall loss accelerating or stable. Still descriptive — extrapolation needs engineering judgement.
Condition monitoring
Watching live or recent indicators against thresholds: vibration alarms, pressure deviation, dump-cycle timing.
Predictive analytics
Models that use condition and historical data to estimate future condition or failure behaviour. Requires validated data, physical understanding, and testing before its outputs should drive work.
Prescriptive maintenance
Systems that recommend specific actions from predictions. The most demanding level — both data-wise and organizationally.
Structured historical data is the input these levels are built on — which is why collecting it well matters even before anyone runs a model.
The environmental dimension
Maintenance and inspection also have environmental implications. U.S. EPA materials describe directed inspection and maintenance (DI&M) approaches for compressor stations and gas processing facilities — methods for detecting, measuring, prioritizing and repairing equipment leaks. The idea is simple: measure, rank by contribution, fix the worst first, verify, and keep the records.
O&M data therefore supports more than equipment uptime. The same inspection records can contribute to leak management, environmental monitoring, compliance documentation, repair prioritization and historical evidence. Specific emissions outcomes depend on the program and facility — this page makes no universal claims about reductions.
What good O&M data looks like
For orientation only: a September 2026 360iResearch market report estimates the global Oil & Gas Operations & Maintenance Services market at USD 195.84B in 2025, USD 206.82B in 2026 and USD 305.45B by 2032 (6.55% CAGR). Separately, Fortune Business Insights estimates the global oil & gas refinery maintenance services market at USD 3.89B in 2025, projecting USD 5.42B by 2034. These are commercial market-research estimates measuring different markets — they should not be combined or read as authoritative industry figures.
This is where field-data infrastructure becomes important
Everything above described the information chain: physical asset → inspection → field data → asset record → integrity assessment → maintenance decision → work performed → historical record. aQRate is designed to support the field-data and connected-record layer of workflows like these — the first and most fragile links.
01
Structured mobile field forms
Inspection forms with controlled pick-lists and nested, repeatable sections — designed for gloved hands, not desktops.
02
Offline field collection
Native iOS/Android apps that keep collecting data with no signal and sync when coverage returns.
03
GPS and location
Every record carries where it was taken, so findings can be placed in facility context.
04
Photos and evidence
Photo capture that stays attached to the finding and the asset rather than in a phone gallery.
05
Parent / child records
Assets, stages and facilities relate to each other — a valve lives inside a scrubber inside a train.
06
Historical records and reporting
Inspection history stays retrievable and exportable, including PDF reports like the Compressor Integrity Audit Report.
07
GIS visualization and dashboards
Records surface on maps and dashboards — from analytics views to custom visualization workflows.
aQRate is not a replacement for CMMS / EAM, SCADA, Process simulation, CAD, Specialized engineering software, Professional engineering judgment, Regulatory programs, Asset-integrity methodologies. It can support, organize and connect field observations to asset context — the specialized work and the judgments remain where they belong.
See it demonstrated: Oil & Gas O&M Demo Use Case
Our existing demonstration — “Modernizing Oil & Gas O&M — Elevating Field Data into Interactive 3D Digital Twins” — illustrates one possible workflow:
The demo is an example of what a connected workflow can look like — not evidence that every O&M operation should use the same architecture. Read Oil & Gas O&M Demo Use Case →
The starter template behind this article
The article's illustrative valve records are shaped like a real, ready-made aQRate template: the “Oil and gas O&M” starter template ships with a standard field inspection of O&G assets — a form like “O&G Valve Inspection — Repeated Form” capturing valve tag, function, position, integrity and photo evidence — plus dashboards and 336 sample records to explore. The animation below shows that form being built and filled in the field.
O&G Valve Inspection- Repeated Form
Valve Tag*
Function*
Position*
Integrity*
Inspection Photo Evidence
O&G Valve Inspection- Repeated Form
V-106
Train 2 Bypass
Fully Closed
No Leak / Nominal
Photo captured
Report ready: Compressor Integrity Audit Report
From maintaining equipment to maintaining operational knowledge
Oil & gas O&M is fundamentally about maintaining physical assets — valves, vessels, compressors, pipelines. But effective maintenance also depends on maintaining reliable knowledge about those assets. That knowledge is a chain:
What the asset is
Where it is
What condition it is in
What has happened to it before
What evidence supports the assessment
What action was taken
What changed afterward
Together those links form a continuous information loop:
Modern digital systems — structured field forms, connected records, GIS visualization, digital models — can help preserve this loop across field teams, engineering, maintenance and management. They do not replace the engineering judgment, standards and programs that give the loop its authority. They make sure the loop does not quietly break between a fence line and a filing cabinet.
See what a connected O&M workflow can look like
Explore an illustrative Oil & Gas O&M workflow that connects structured field inspections with asset context, GIS visualization, 3D facility models, and historical inspection data.
Sources & further reading
Petroleum, petrochemical and natural gas industries framework for equipment, failure and maintenance data.
Mechanical-integrity provisions and covered equipment in the U.S. PSM regulatory scope.
Inspection, maintenance and repair history, corrosion, equipment condition and documentation guidance.
Elements of a risk-based inspection program and risk-based inspection methodology, listed among API standards.
Methodological reference for RCM: functions, functional failures, failure modes, consequences, tasks.
Findings on safety-critical elements and the management systems intended to keep them reliable and available.
Peer-reviewed digital-twin literature (2025)
Systematic reviews of digital twins for oil-and-gas production systems and processing plants: definitions, data integration, interoperability, validation and lifecycle challenges.